Visualization (sisl.viz)
This is a full visualization framework developed specifically for sisl to visualize
all the processing that you can do with the package. The aim is to provide a high-level API
to generate plots through sisl, so that you can avoid boilerplate code and the iteration loop
with your results can be as fast as possible.
The plots that you can generate with it are not bound to a specific visualization framework. Instead, the users
can choose the one that they want based on their taste or on what is available in their environment. Currently,
there is support for visualizing the plots with plotly, matplotlib, blender. The flexibility of the framework
allows for the user to extend the visualizing options quite simply without modifying sisl’s internal code.
The framework started as a GUI, but then evolved to make it usable by sisl users directly. Therefore,
it can serve as a very robust (highly tested) and feature full backend to integrate visualizations into graphical interfaces.
An example of this is the sisl-gui package.
Basic Tutorials
Following, you will find some tutorials that will introduce you to the framework.
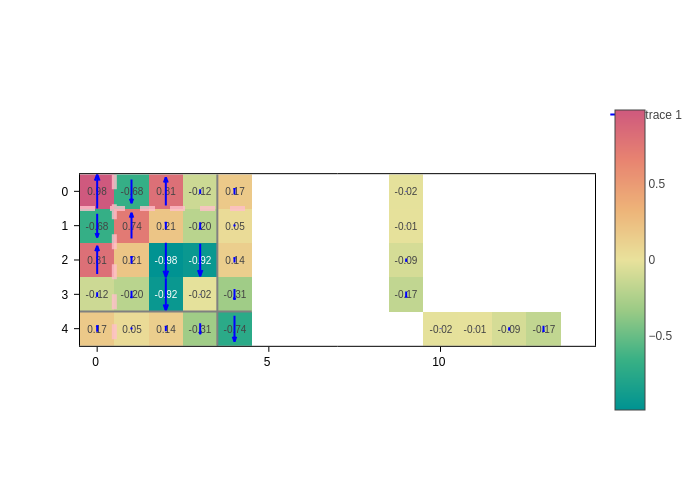
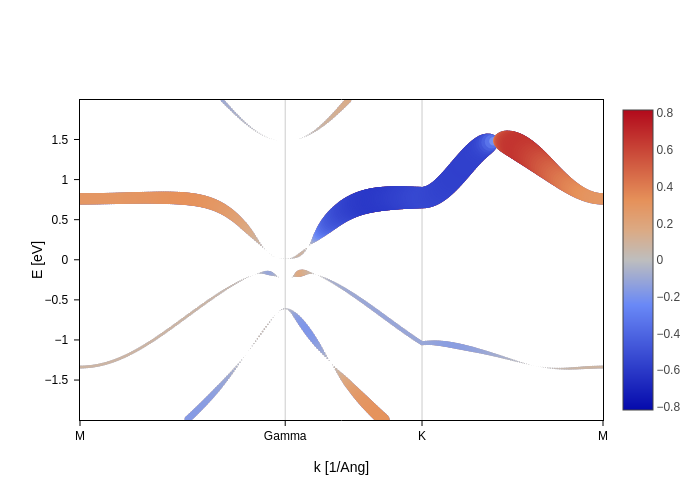
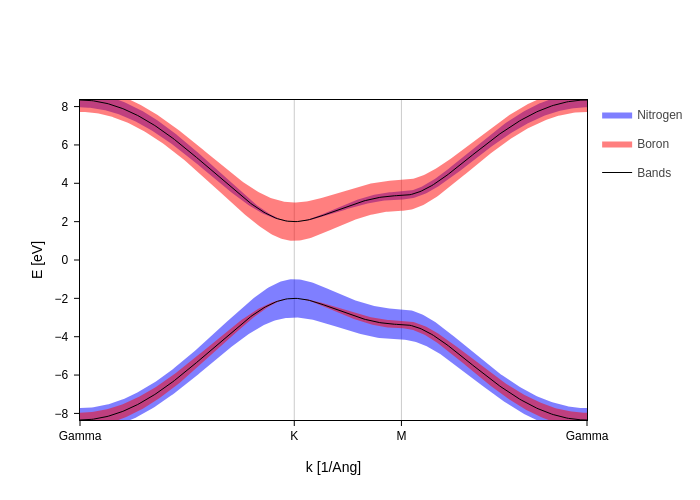
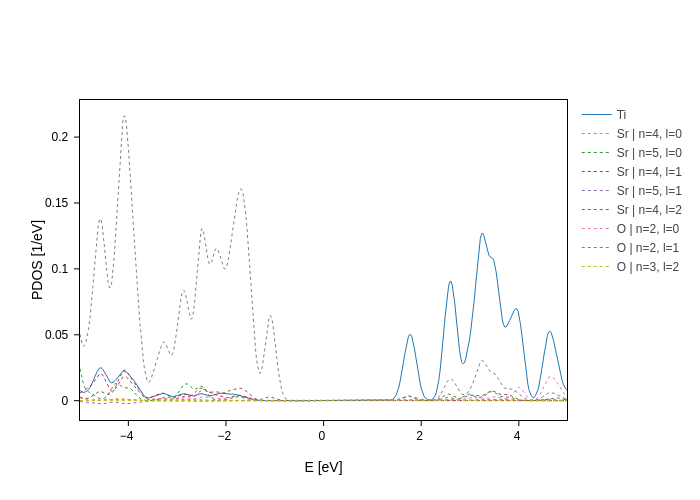
Showcase of plot classes
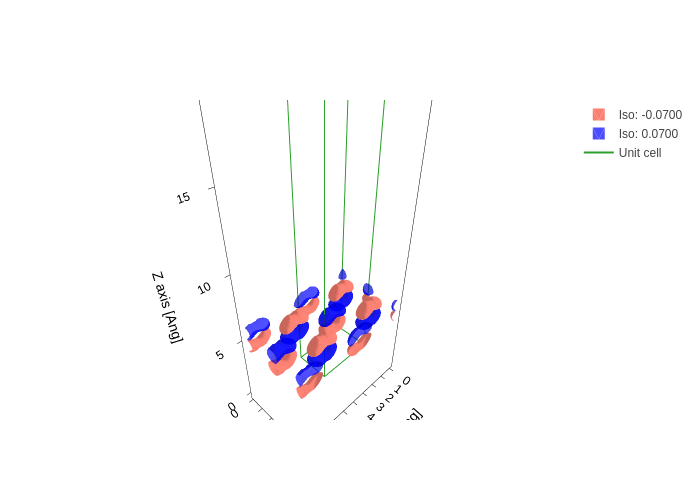
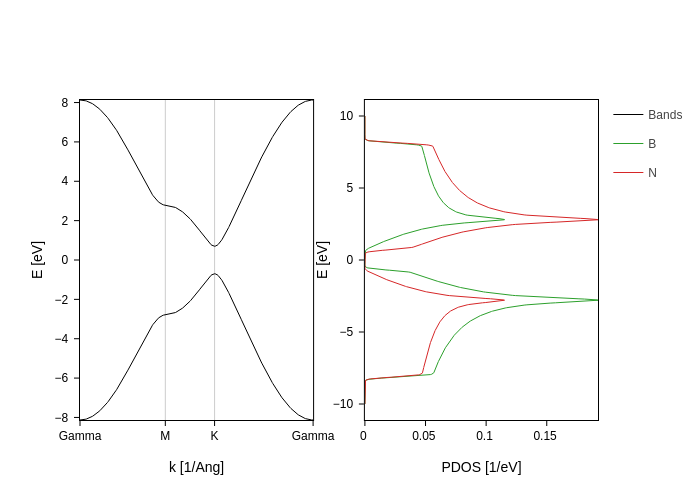
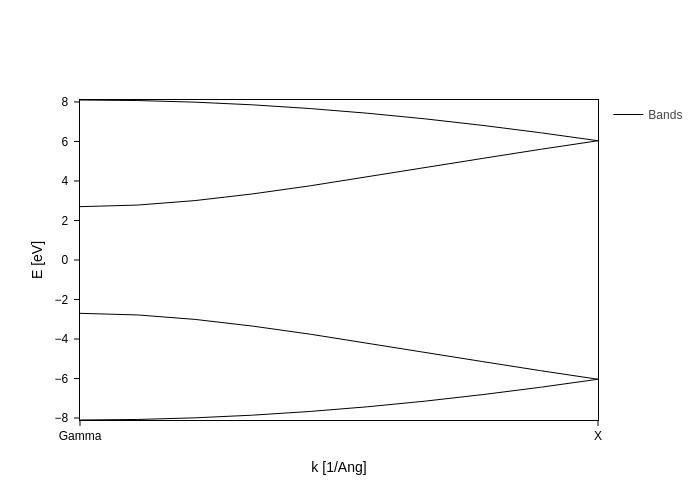
The following notebooks will help you develop a deeper understanding of what each plot class is capable of.
Using it with blender
The sisl visualization framework is independent of the plotting backend used, but blender is a special one. Therefore we dedicate this section to it with the hope of making the usage of it less confusing.
Combining plots
Have two plots that you would like to see displayed together, maybe as an animation or subplots? You’ve come to the right place!
Do it yourself
Whether you feel like you would like to customize the framework a bit to fit your needs, you are a sisl
developer or you are building a framework (e.g. GUI) around sisl.viz, this is your section!
Note
Consider contributing to the package if you build a useful extension. The community will appreciate it! :)
